UtilityViz: an R package to visualise and simulate future utility consumptions
The storage stake is one significant piece of infrastructure in modern business operations. The cost associated with managing exploding data volume can not be underestimated in modern increasing data-driven decision models.
Here, we present an R package that enables future utilization modelling based on historical time-series data and further support the evidence-based procurement decision making process by simulating financial outcomes on various procurement strategies. In addition, the proposed workflow is further supported by visualizations and an easy-to-use dashboard framework. More detail please visit UtilityViz home page.
Sneak Peak of the Dashboard
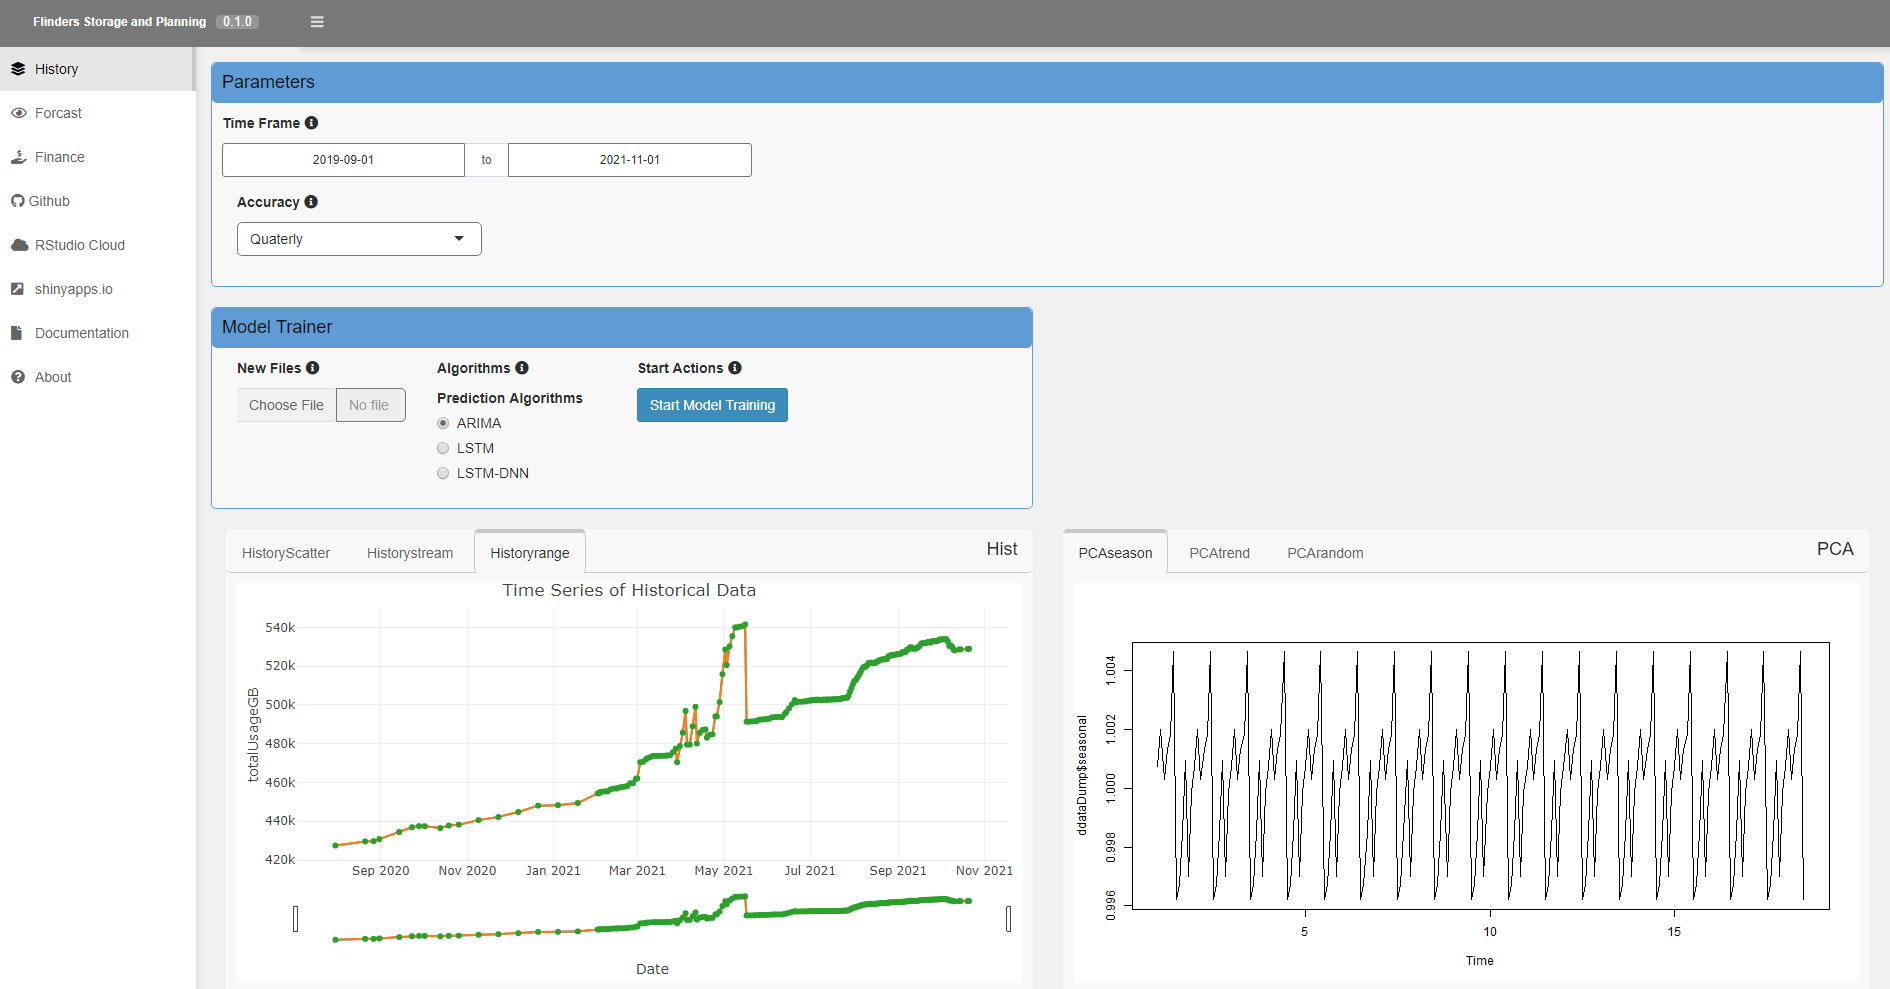
Figure 1: An example of a historical data visulizaiton with UtilityViz dashboard.
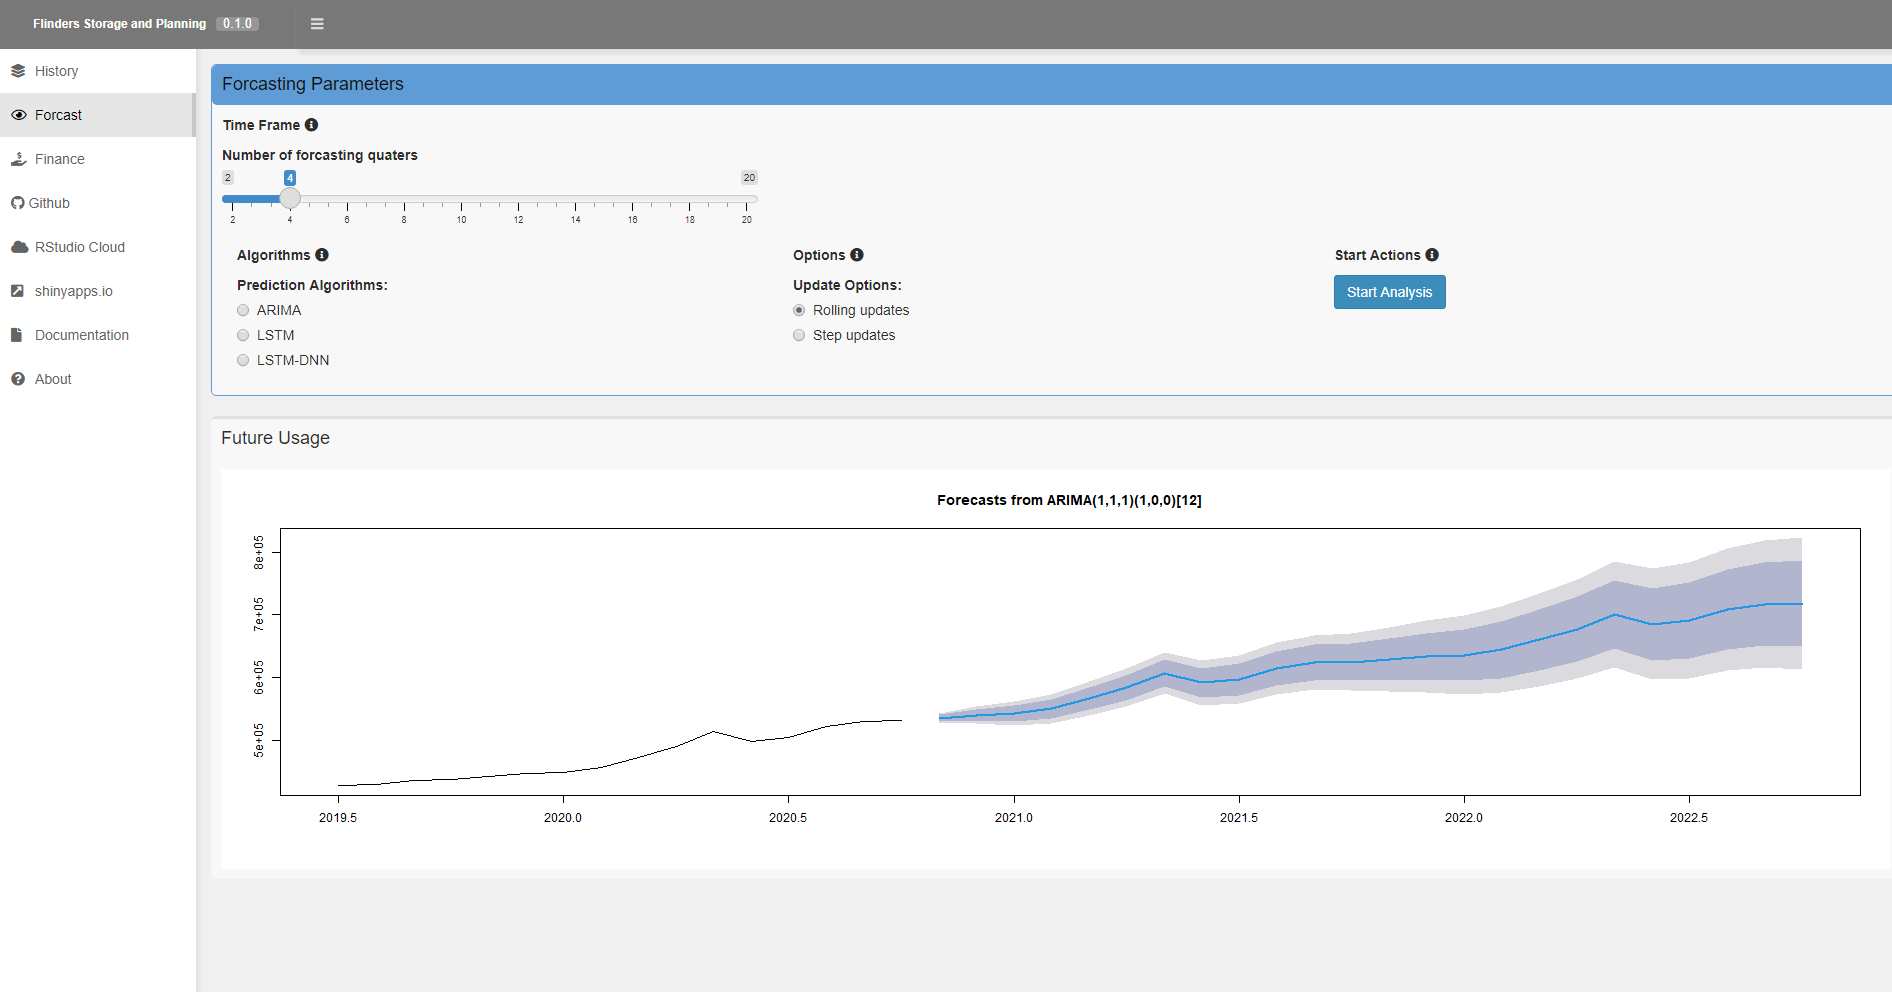
Figure 2: An example of a future demand forecast workflow with UtilityViz dashboard.
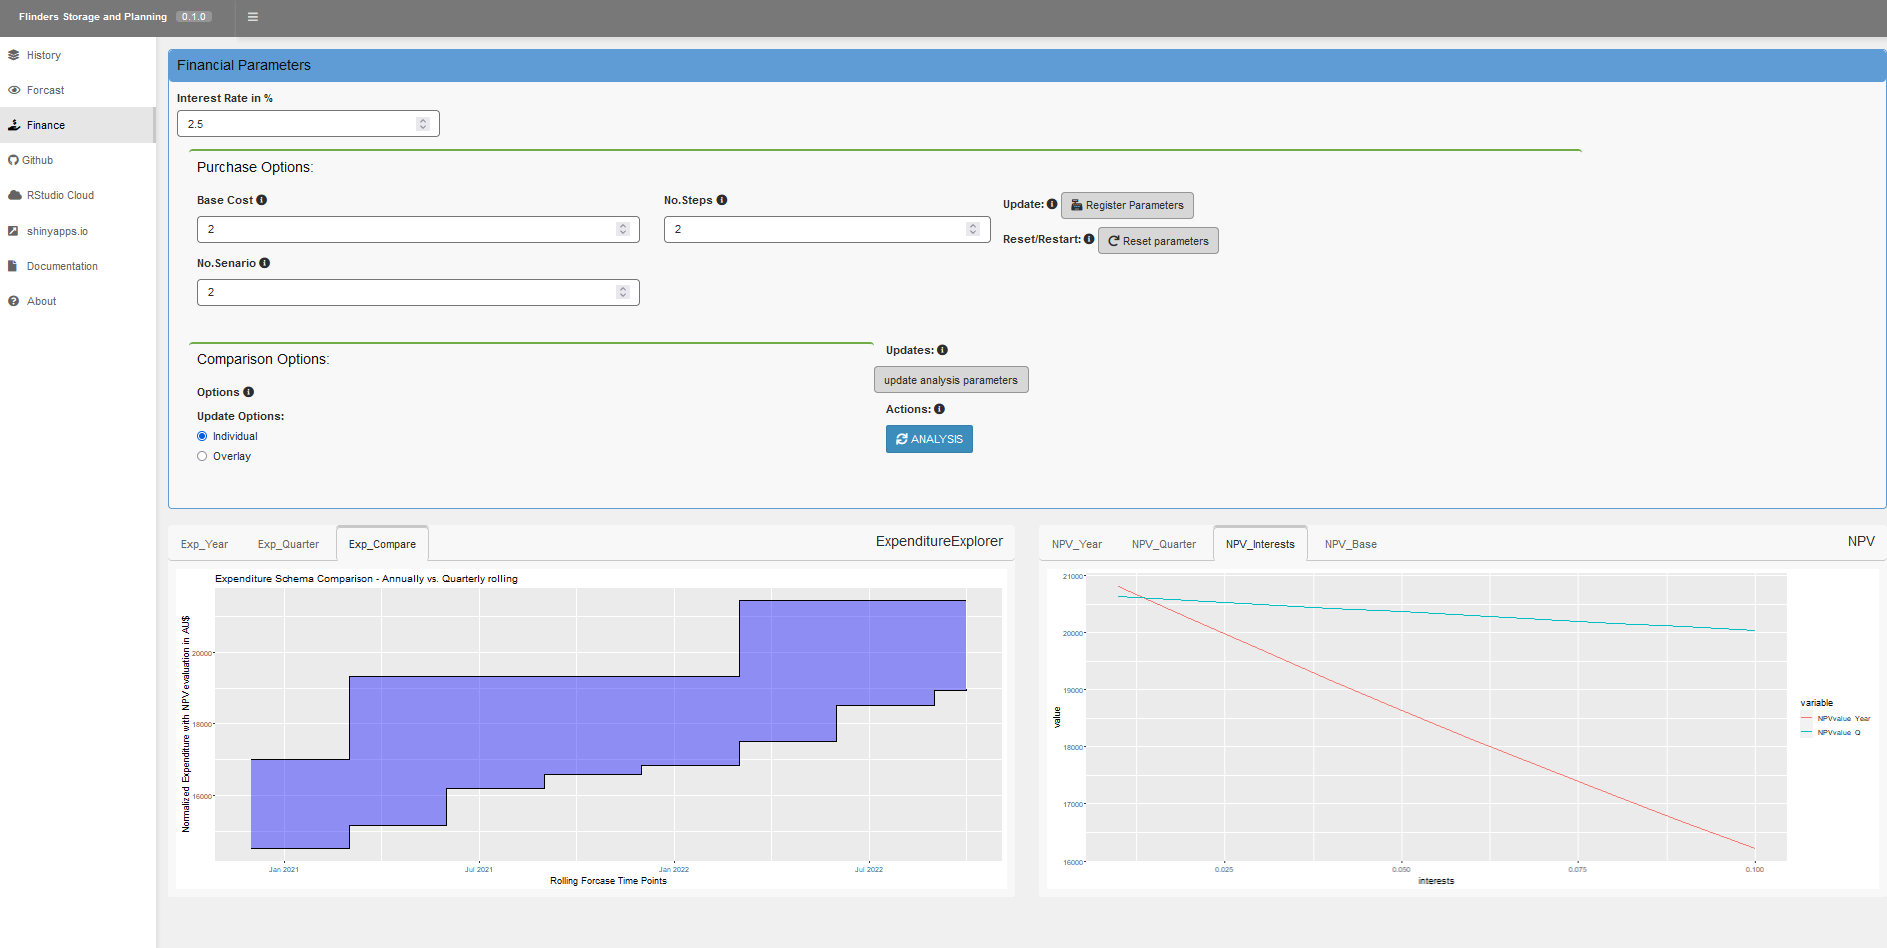
Figure 3: An example of a financial strategy simulation with UtilityViz dashboard.


Leave a comment