substrateminer: A python package to discover enzyme substrates based on sequence consensus
Visualising the synteny across species not only enables intuitive examination and facilitates the reconstruction effort of ancestral genomes, but also allow more direct interrogation of gene regulations and gene structures within a gene cluster.
Here we present an R package SyntenyViz to facilitate the visualization of synteny across various biological species. More detail please visit SyntenyViz home page.
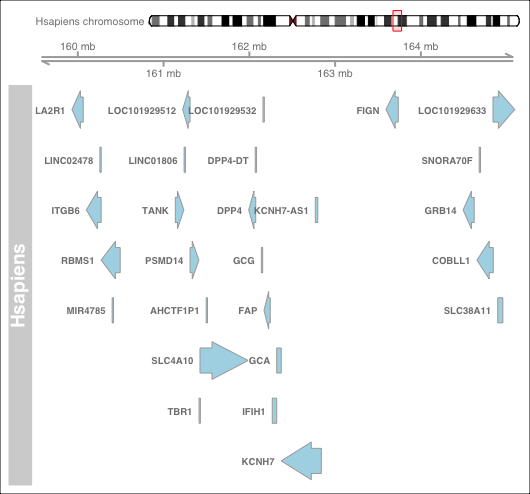
Figure 1: An example of a Single Synteny Plot
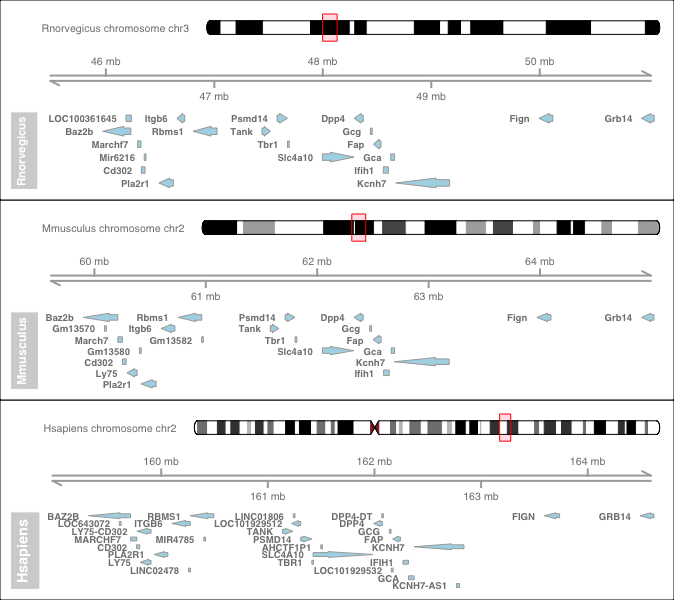
Figure 2: An example of a Multiple Synteny Conservation Plot


Leave a comment